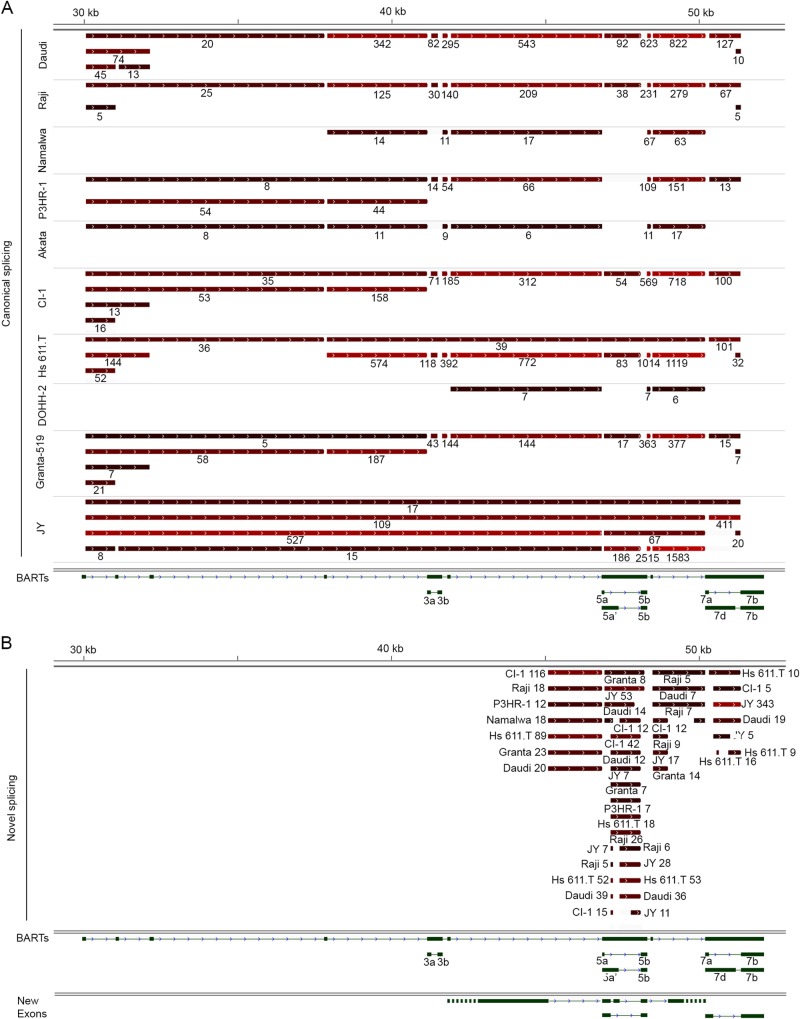
FIG 5.
Evidence of new splicing of BARTs in the BamHI A region of the EBV genome. (A) Canonical splicing of BARTs is shown for each cell line. (B) Novel splicing events identified in each cell line. Each bar represents a spliced-out intron with color intensity (black to red) reflecting read abundance for each splicing event (total read number was shown below each bar). Only introns with more than five reads are shown.

