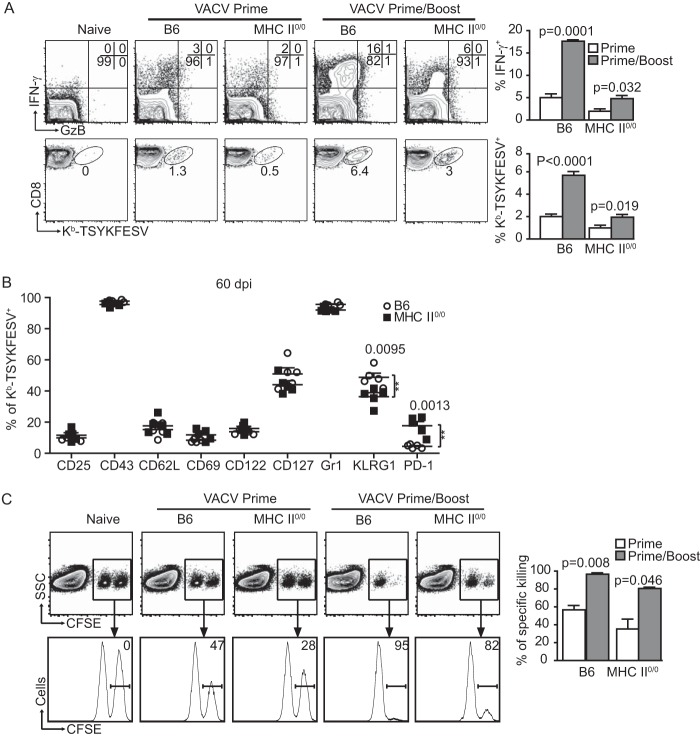
FIG 2.
Unhelped CD8M expand and generate secondary CD8M cells when maintained and boosted in an MHC-II-deficient environment. B6 mice and MHC-II0/0 mice were primed i.p. with 5 × 10⁶ PFU VACV and, when applicable, similarly boosted 5 weeks later. (A) CD8M in spleen were determined at 60 dpp or dpb; the cells were gated on CD8+ T cells. Representative flow cytometry plots on the left show IFN-γ and GzB expression after in vitro restimulation with VACV-infected DC2.4 cells (top row) and staining with Kb-TSYKFESV+ dimers (bottom row). The summary graphs on the right show the frequency of IFN-γ+ and Kb-TSYKFESV+ CD8M. (B) Frequency of Kb-TSYKFESV+ CD8M expressing the indicated cell surface molecules at 60 dpp or dpb. (C) In vivo killing of target cells by CD8M. Splenocytes from naive B6 mice were labeled with CFSE at 3.0 μM (CFSEHigh) or 0.8 μM (CFSELow). CFSEHigh cells were pulsed with TSYKFESV, and CFSELow were not. Mixtures (1/1) of CFSEHigh and CFSELow cells were injected i.v. into primed or primed/boosted B6 and MHC-II0/0 mice at 60 dpp or dpb. Killing was determined 6 h later in spleen. Representative flow cytometry plots are shown on the left. Plots in the upper row are gated on CD8+ cells. The transferred cells can be distinguished by their CFSE expression. The histograms in the lower row show the peaks of CFSELow and CFSEHigh cells. The number inside the plot indicates the percentage of specific killing of CFSEHigh (TSYKFESV-pulsed) cells. Data correspond to groups of three to five mice and are representative of results from two or three experiments.

