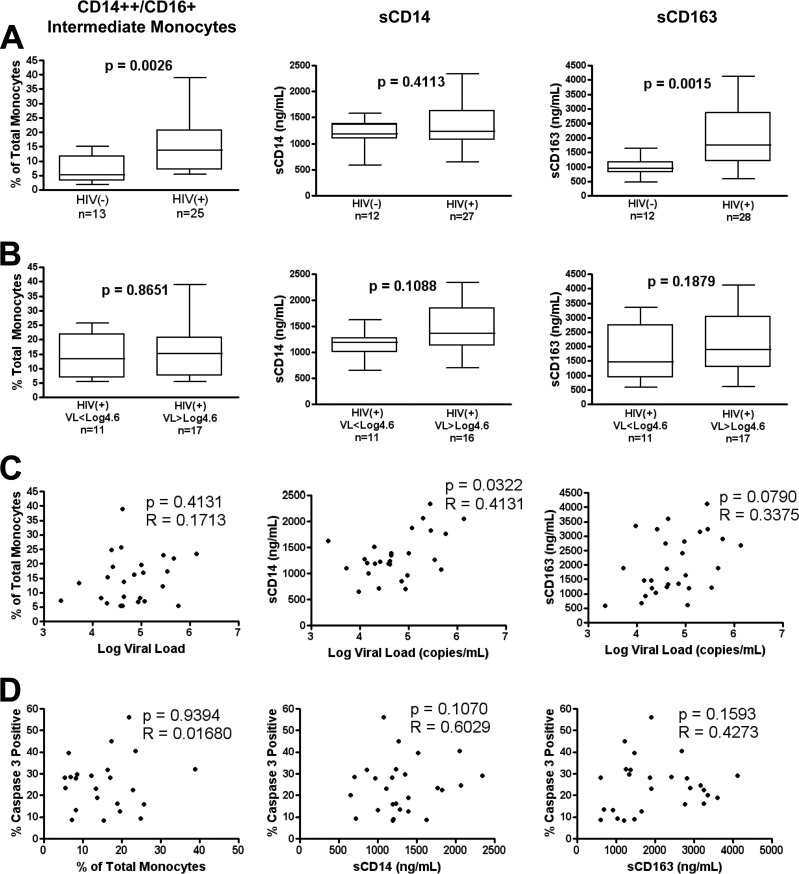
FIG 3.
Monocyte/macrophage activation in HIV+ patient cohort. (A and B) Groupwise comparison of percentage of intermediate CD14++ CD16+ monocytes (left), plasma sCD14 (middle), and plasma sCD163 (right) in HIV− versus HIV+ individuals (A) and HIV+ patients below versus above 40,000 (log10 4.6) copies/ml (B). (C and D) Spearman ranked correlation of viral load (C) and induced apoptosis (D) versus monocyte/macrophage activation metrics. Groupwise comparison displays median, interquartile range (box), and range (whiskers) using the Mann-Whitney test (two-tailed), with a P value of <0.05 considered significant. Spearman (two tailed) rho and P values are displayed.

