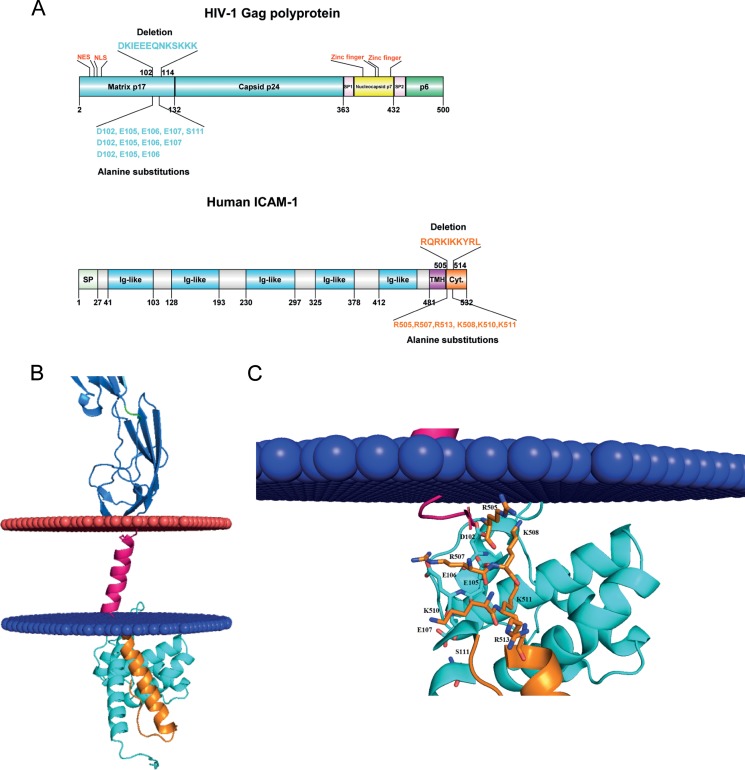
FIG 5.
Molecular docking of putative interactions between HIV-1 MA and host-derived ICAM-1. (A) Diagram representation of the HIV-1 Pr55Gag precursor polyprotein (top) and ICAM-1 (bottom). Matrix and CA are shown in cyan, NC is shown in yellow, p6 is shown in green, and SP1 and SP2 regions are depicted in pink. For ICAM-1, the signal peptide (SP) is illustrated in green, the five-immunoglobulin-like domain is in blue, the hydrophobic transmembrane domain (TMH) is in purple, and the cytoplasmic domain is in orange. NLS, nuclear localization signal; NES, nuclear export signal. (B) Close-up view of negative residues (HIV-1 MA) and positive residues (cytoplasmic region of ICAM-1) that participate in the interaction. Negative and positive residues are shown as sticks. In this 3D model, D102 forms ionic bonds with R507-K508, E105 forms bonds with R507-K508-K510-K511, and E106 forms bonds with R507-K510. (C) Schematic representation of the 3D model of HIV-1 MA (PDB accession number 1L6N) docked to a 3D model of human ICAM-1 anchored in the cytoplasmic membrane (blue and red). The colors used for the model are the same as those described above for panel A.

