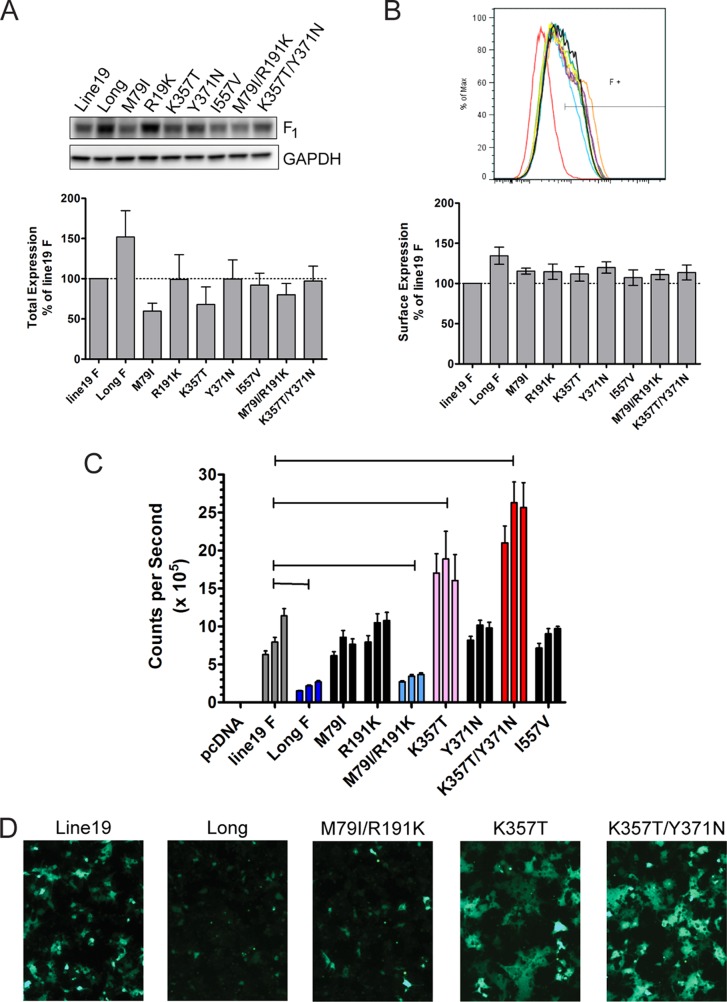
FIG 2.
F expression and cell-cell fusion activity. (A) 293T cells were transfected with F mutant plasmids in the presence of the fusion inhibitor BMS-433771, and lysates were harvested 24 h posttransfection for F-specific Western blotting. A representative F blot is shown with a GAPDH loading control. The bar graph shows expression as a percentage of line 19 F for three experiments combined. (B) Surface expression of the F mutants determined by flow cytometry of 293T cells harvested 24 h posttransfection with F mutant plasmids in the presence of BMS-433771. The histogram displays results from a single experiment, and the bar graph shows expression as a percentage of line 19 F from three experiments combined. (C and D) F expression plasmids were transfected into 293T cells in the presence of fusion inhibitor, and cell-cell fusion activity was quantified by luciferase activity or monitored by GFP expression. Representative results are shown for luciferase activity (C) and GFP expression (D). Luciferase activity was measured at 4, 6, and 8 h post-cell mixing, indicated from left to right by the three bars for each F construct. Cross bars in panel C indicate groups significantly different compared to line 19 F. *, P < 0.05 by one-way analysis of variance (ANOVA) and Tukey multiple-comparison test. (D) Images of GFP-expressing cells were taken 8 h post-cell mixing.

