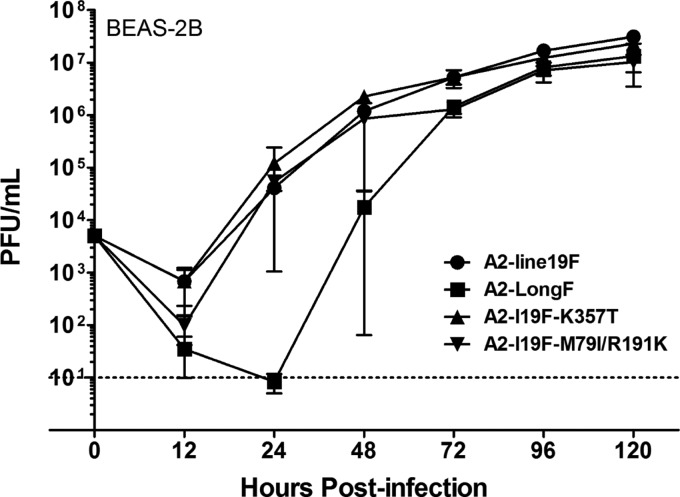
FIG 3.
Virus replication in BEAS-2B cells. BEAS-2B cells were infected at an MOI of 0.01 with each virus, and cells were harvested at the designated time points for viral titer quantification. Input virus titer is represented as the zero time point. A composite of three experiments is shown. There were no significant differences between viruses at each time point by one-way ANOVA.

