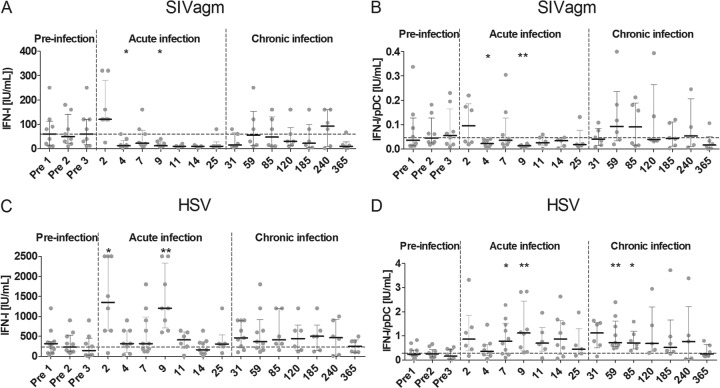
FIG 1.
Dynamics of IFN-I-producing capacity during SIVagm infection. We stimulated AGM PBMCs collected before and during the course of SIVagm infection and measured IFN-I production in the supernatant. The x axis displays the day postinfection at which cells were isolated and stimulated with SIV (A and B) or HSV (C and D). The y axis shows the total IFN-I produced after 18 h of stimulation (A and C) or the same IFN-I production corrected for the number of plasmacytoid dendritic cells among the PBMCs (B and D). The dashed horizontal line shows the median for all preinfection time point stimulations. The dashed vertical lines separate the stages of infection. Symbols represent individual animals (n = 5 to 11 for each time point). *, Wilcoxon, P < 0.05; **, Wilcoxon, P < 0.01. The P values indicate significant differences compared to the preinfection baseline.

