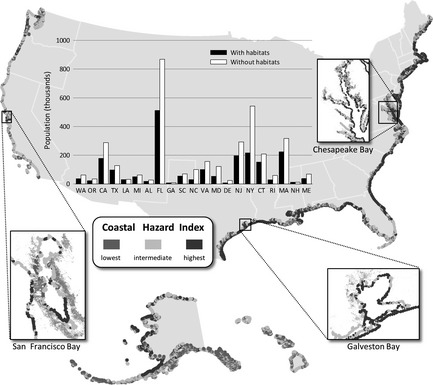
Figure 5.

Protection from storm surge provided by coastal habitats. Warmer colours indicate regions anticipated in 2100 to have the greatest exposure to storm hazards, given anticipated sea level rise and other impacts of climate change. In the inset graph, black bars show the number of people in each coastal state living in areas most exposed to hazards (red areas in the map) with protection provided by habitats. White bars show the larger numbers of people that would be exposed to this same high level of risk if habitats were lost due to climate change or human impacts. Reprinted from Arkema et al. (2013), first published in Nature Climate Change.
