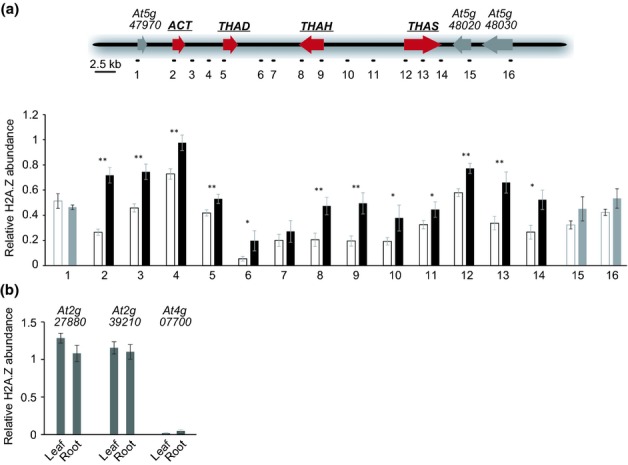
Fig 3.

Chromatin immunoprecipitation (ChIP) analysis of H2A.Z abundance in the thalianol gene cluster. (a) H2A.Z abundance within the thalianol gene cluster was measured in chromatin preparations from leaves (white bars) and roots (black bars) of seedlings of Arabidopsis thaliana accession Col-0. H2A.Z abundance in different regions of the cluster was quantified relative to FLOWERING LOCUS C (FLC) (the white bars with grey outlines and the grey bars show data for regions outside the gene cluster). The probes used for this analysis (shown below the histogram) are indicated in the map of the thalianol cluster. Error bars indicate standard deviation of three biological replicates. Significance differences in H2A.Z abundance between leaves and roots (t-test): *P < 0.05; **P < 0.01. (b) H2A.Z abundance at selected control loci. At2g27880 and At2g39210 were used because both have been shown to be marked with the H2A.Z histone variant, have SWR1 dependent expression and do not show differential transcription rate between roots and leaves (based on AtGenExpress) (March-Diaz et al., 2008; Zilberman et al., 2008). The At4g07700 locus was chosen as a negative control for the ChIP experiment, because it has been shown that H2A.Z is not incorporated into nucleosomes of this locus (Kumar & Wigge, 2010). H2A.Z abundance at these loci was quantified relative to FLC. Error bars indicate standard deviation of three biological replicates.
