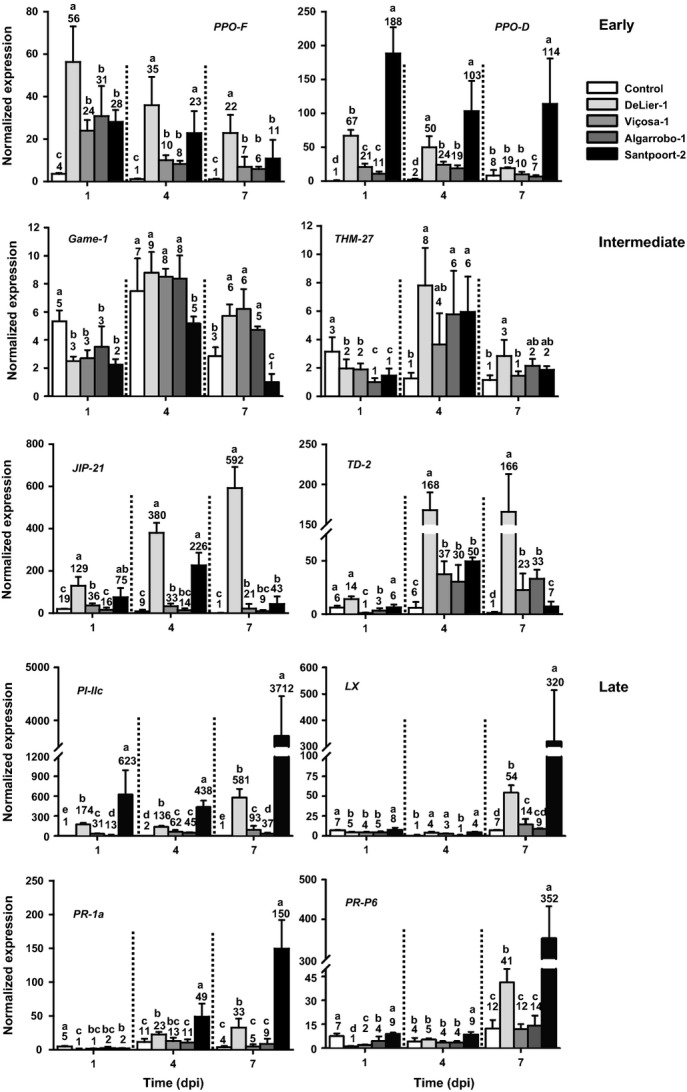
Fig 3.

Relative transcript abundances of various defense-related genes in spider mite-infested tomato (Solanum lycopersicum) leaflets during the course of 7 d. Based on the Tetranychus urticae Santpoort-2 samples, the genes separated into three groups: those whose transcript abundances were highest at 1 d postinfestation (dpi) were annotated as ‘early’; those with a peak at 4 dpi as ‘intermediate’; and those with a peak at 7 dpi as ‘late’. Compared with T. urticae Santpoort-2, both Tetranychus evansi Viçosa-1 and T. evansi Algarrobo-1 mites suppressed genes from all three groups, while T. urticae DeLier-1 mites only moderately suppressed the ‘late’ defense genes. Uninfested leaflets were used as controls. The bars represent the means (+ SEM) of the normalized transcript abundances scaled to the lowest mean value per 7 d gene panel. Transcript abundances were normalized to actin. Numbers above the bars indicate the mean value represented by the bar. Expression data were statistically evaluated per day and bars annotated with different letters were significantly different according to Fisher's LSD test (P ≤ 0.05) after ANOVA. Gene identifiers and corresponding references can be found in Table S2. GAME-1,Glycoalkaloid Metabolism-1;JIP-21,Jasmonate-inducible protein-21;LX,RNase Lycopersicon extravacuolar;PI-IIc,Proteinase Inhibitor IIc;PPO-D,Polyphenol-oxidase-D;PPO-F,Polyphenol-oxidase-F;PR-1a,Pathogenesis-related protein 1a;PR-P6,Pathogenesis-related protein 6;TD-2,Threonine Deaminase-2;THM27,Tomato Hypocotyl Myb 17.
