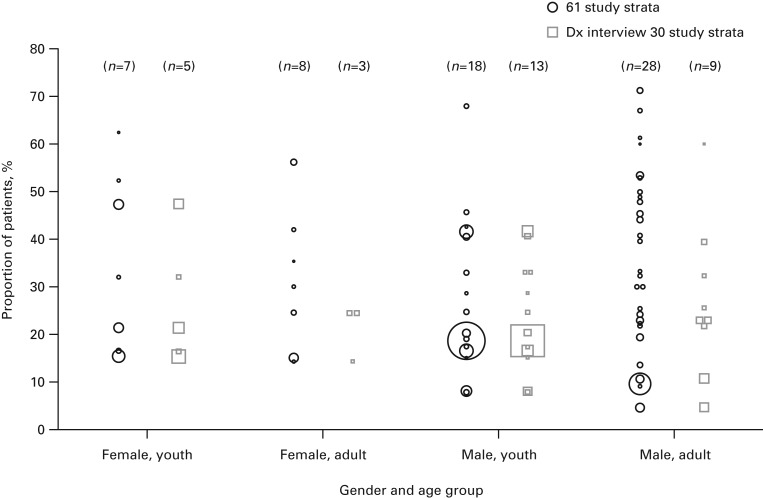
Fig. 2.
Observed attention deficit hyperactivity disorder prevalence per study stratum by age group (youths ⩽18 years and adults >18 years) and gender showing all data (42 studies, 61 strata) and interview diagnosis (Dx) strata (21 studies, 30 strata). Each bubble/square in the plot represents a study stratum. Bubble/square areas are proportional to stratum sample size. The numbers of study strata per column are shown in parentheses.

