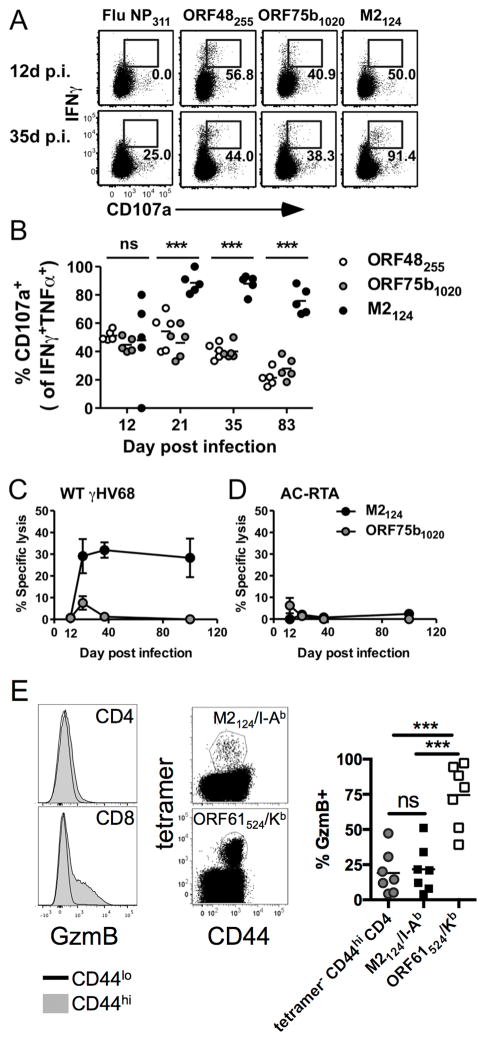
Figure 5. M2124-138-specific CD4 T cells are cytotoxic.
(A) Representative dot plots showing IFNγ production and CD107a expression by lung CD4 T cells at 12 or 35 d after WT γHV68 infection. Numbers in the plots indicate the percent of IFNγ+TNFα+ CD4 T cells expressing CD107a. (B) The percent of IFNγ+TNFα+ CD4 T cells that are CD107a+ in the lungs over time after WT γHV68 infection (n=5, representative of 4 experiments; ns, not significant; ***P≤0.001; one-way ANOVA). (C) Specific lysis of peptide-pulsed target cells (±SEM) in WT γHV68-infected mice (n=4–9, combined from 2 experiments). (D) Specific lysis of peptide-pulsed target cells (±SEM) in AC-RTA-infected mice (n=5–7, combined from 2 experiments). (E) 21 d after WT γHV68 infection spleens were harvested and analyzed by flow cytometry. (left) Representative histograms showing granzyme B (GzmB) expression in CD44hi or CD44lo CD4 (top) or CD8 T cells (bottom). (center) Representative dot plots showing expression of CD44 and either M2124-138/I-Ab (top) or ORF61524-531/Kb (bottom) tetramers. (right) The percent of cells expressing granzyme B. (n=7, representative of 3 experiments; ns, not significant; ***P≤0.001; one-way ANOVA).

