
Figure 4.
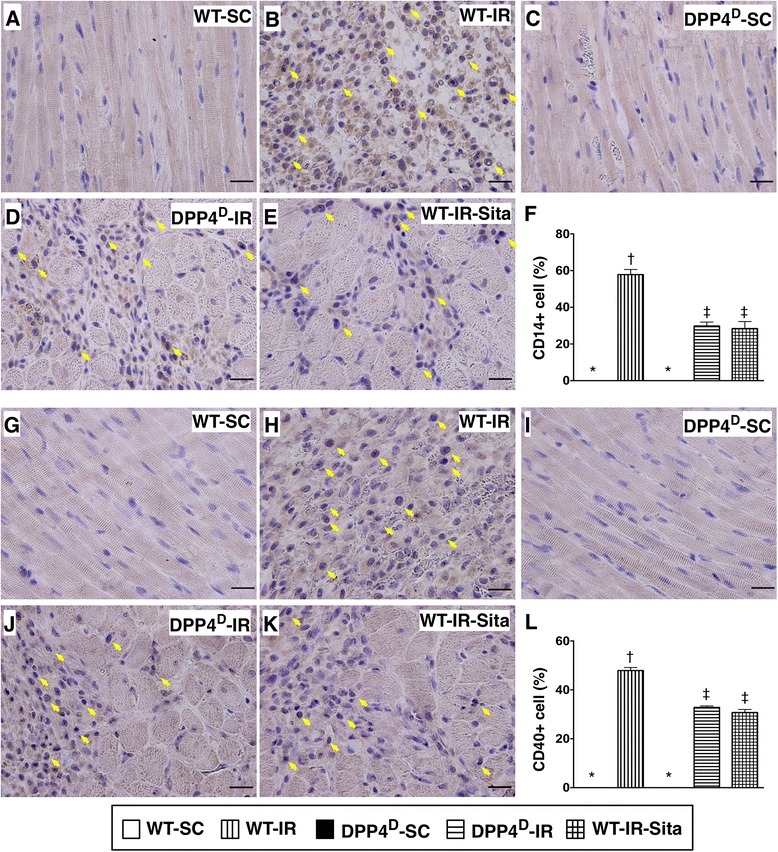
Immunohistochemical (IHC) stains of inflammatory cell infiltrations in LV myocardium at 72 h after IR procedure. A to E) Microscopic findings (400×) of IHC staining for identifying CD14+ cells (brown color) (yellow arrows) in infarct area. F) Comparison of number of CD14+ cells among the five groups. p < 0.0001, * vs. other groups with different symbols (*, †, ‡). Scale bars in right lower corner represent 20 μm. G to K) Microscopic findings (400×) of IHC stain for identifying CD40+ cells (brown color) (yellow arrows) in infarct area. L) Comparison of number of CD40+ cells among the five groups. p < 0.0001, * vs. other groups with different symbols (*, †, ‡). Scale bars in right lower corner represent 20 μm. All statistical analyses were performed by one-way ANOVA, followed by Bonferroni multiple comparison post hoc test (n = 8). Symbols (*, †, ‡) indicate significance (at 0.05 level). WT-SC = wide type sham control; WT-IR = wide type + ischemia reperfusion (IR); DDP4D-SC = dipeptidyl peptidase-IV (DPP4) deficiency sham control; DDP4D-IR = DDP4D + IR; WT-IR-Sita = wide type + IR + sitagliptin.