
Figure 8.
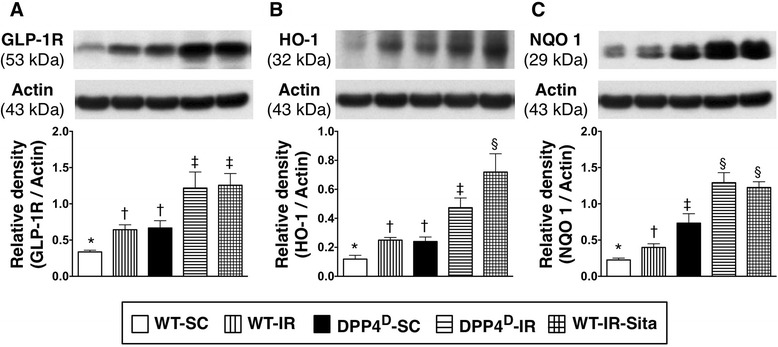
Protein expressions of GLP-1 and antioxidants in LV myocardium at 72 h after IR procedure. A) Protein expression of glycogen-like peptide-1 (GLP-1) in LV myocardium. p < 0.001, * vs. other groups with different symbols (*, †, ‡). B) Protein expression heme oxygense (HO)-1 in LV myocardium. p < 0.001, * vs. other groups with different symbols (*, †, ‡, §). C) Protein expression of NAD(P)H quinone oxidoreductase (NQO) 1 in LV myocardium. p < 0.001, * vs. other groups with different symbols (*, †, ‡, §). All statistical analyses were performed by one-way ANOVA, followed by Bonferroni multiple comparison post hoc test (n = 8). Symbols (*, †, ‡) indicate significance (at 0.05 level). WT-SC = wide type sham control; WT-IR = wide type + ischemia reperfusion; DDP4D-SC = dipeptidyl peptidase-IV (DPP4) deficiency sham control; DDP4D-IR = DDP4D + ischemia reperfusion; WT-IR-Sita = wide type + ischemia reperfusion + sitagliptin.