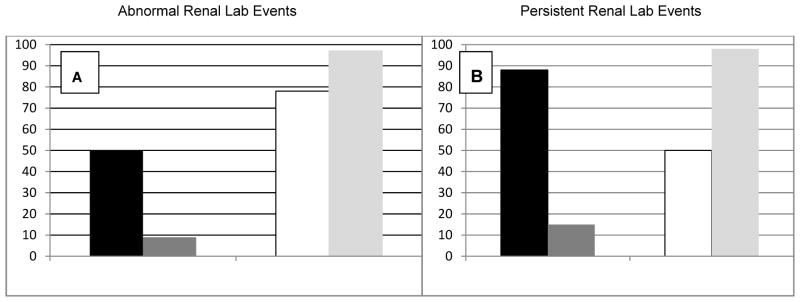
Figure 2.

Sensitivity (Black bar), Specificity(White bar), Positive(Dark Gray bar) and Negative(Light Gray bar) Predictive Values of Abnormal Renal Lab Events(Panel A) in the source population(1874) and Persistent Renal Lab Events (Panel B) in the group with RLE (428) for New Renal Diagnoses.
