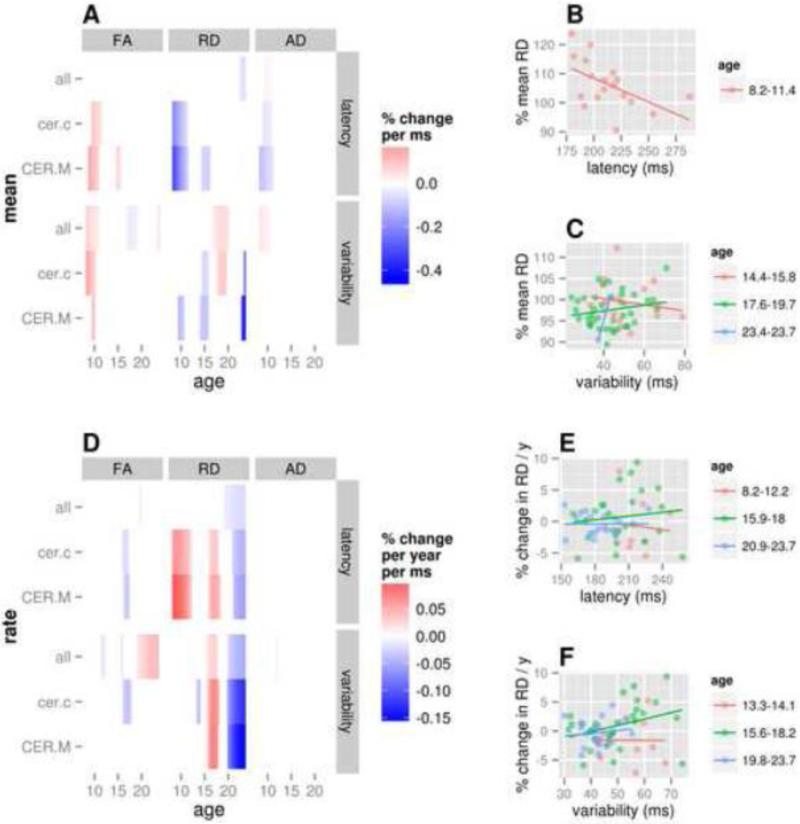
Figure 3. Associations between VGS latency/variability and WM development.
Heatmaps represent the association between the behavioral variables and (A) mean WM levels and (D) rates of change in WM development. These plots are divided into three columns corresponding to FA, RD and AD, respectively; they are further divided by behavioral variable (top=latency, bottom=variability). Each row is an ROI whose label abbreviation is explained in Table 1; included ROIs were significant for at least one of the three measures. RD was the only measure significantly associated with latency, while FA and RD were both related to variability. Colors represent magnitude of brain behavior correlation (red=positive, blue=negative). The scatterplots further illustrate these associations in a single region (cer.c) for the measure RD by showing individual subject brain and behavioral measures within significant stages of association; data points (single scans or scan-to-scan changes) were included if they fell within the stage (in some cases, subjects have multiple points plotted). For each stage, a simple linear fit is shown highlighting the direction of association (B: mean-level RD vs. latency; C: mean-level RD vs. variability; E: rate of change in RD vs. latency; F: rate of change in RD vs. variability). Colors in these plots represent different significant stages of association, with ages identified in the legends.

