
Figure 2.
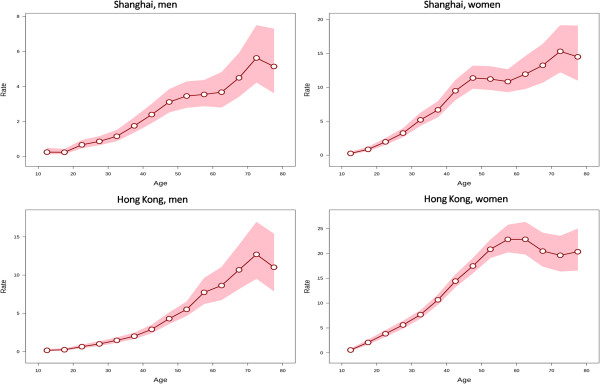
Longitudinal age curves of thyroid cancer incidence rates. Longitudinal age curves of the incidence rates (1/100 000) of thyroid cancer and the corresponding 95% confidence intervals by sex in Shanghai and Hong Kong.
Official websites use .gov
A
.gov website belongs to an official
government organization in the United States.
Secure .gov websites use HTTPS
A lock (
) or https:// means you've safely
connected to the .gov website. Share sensitive
information only on official, secure websites.
Longitudinal age curves of thyroid cancer incidence rates. Longitudinal age curves of the incidence rates (1/100 000) of thyroid cancer and the corresponding 95% confidence intervals by sex in Shanghai and Hong Kong.