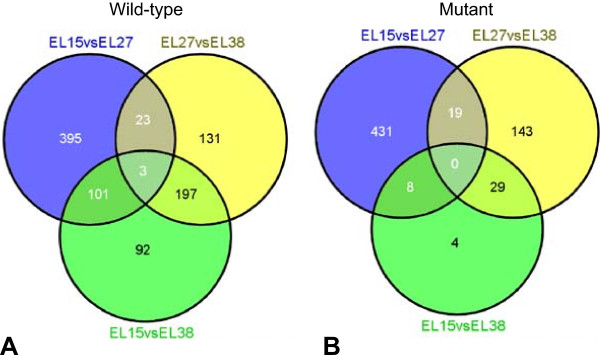
Figure 3.

Comparison of differential gene expression in the pairwise comparison of developmental stages in wild-type and mutant plants. Venn diagrams indicate overlap of all differentially expressed genes obtained from each pairwise comparison between developmental stages (E-L 15 vs E-L 27, E-L 27 vs E-L 38 and E-L 15 vs E-L 38) in wild-type (A) and mutant (B).
