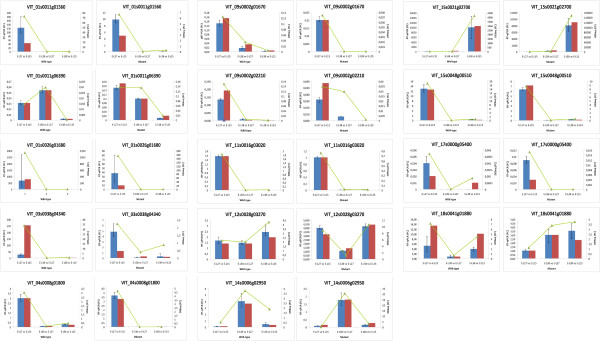
Figure 4.

Quantitative real-time PCR validation of RNA-Seq data. Relative expression profile of 14 genes shows the expression fold change (FC) in the pairwise comparison between developmental stages for the wild-type and the mutant. Histograms represent expression fold changes as assessed by real-time PCR (by using REST), data are reported as means ± SE of three technical replicates (left axis). Green lines represent expression fold changes as assessed by RNA-Seq (by using DESeq, right axis). Blue column with error bar corresponds to the first biological replicate, while red column corresponds to the second biological replicate on which RNA sequencing was carried out.
