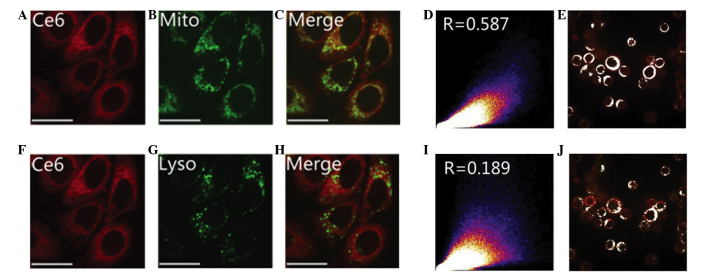
Figure 2.
Images demonstrating Chlorin e6 (Ce6) co-localization with mitochondria and lysosomes. Following 3 h of incubation, (A and F) Ce6, (B) mitochondrial, (G) lysosomal and (C) Ce6-mitochondrial and (H) Ce6-lysosomal cellular localization was revealed via fluorescence imaging (bar scale, 20 μm). Scatter plots reveal the (D and E) Ce6-mitochondria and (I and J) Ce6- lysosome correlation coefficients. Mito, mitochondria; Lyso, lysosome.

