Figure 5.

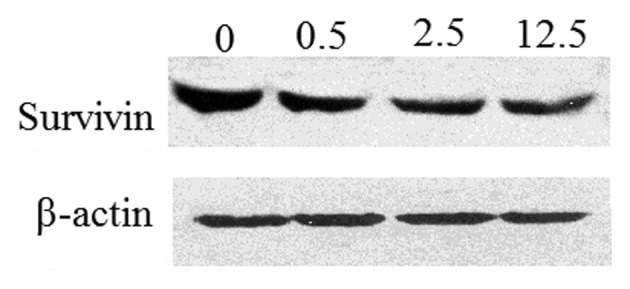
Protein expression levels of survivin following treatment with increasing concentrations of evodiamine for 12 h. 0, control group; 0.5, 0.5 μg/ml evodiamine; 2.5, 2.5 μg/ml evodiamine; 12.5, 12.5 μg/ml evodiamine.

Protein expression levels of survivin following treatment with increasing concentrations of evodiamine for 12 h. 0, control group; 0.5, 0.5 μg/ml evodiamine; 2.5, 2.5 μg/ml evodiamine; 12.5, 12.5 μg/ml evodiamine.