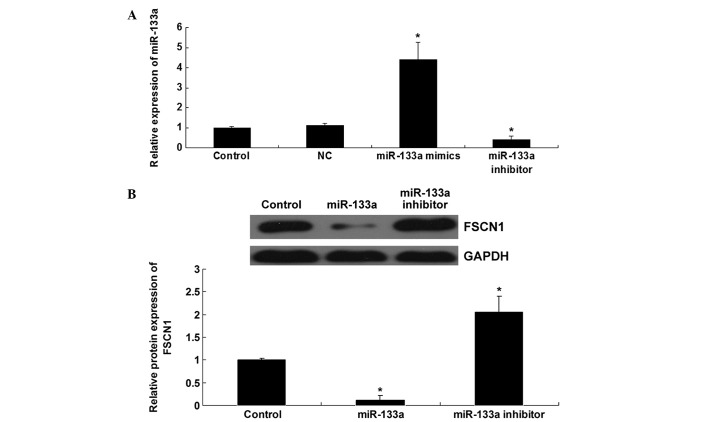
Figure 3.
(A) Reverse transcription-quantitative polymerase chain reaction was performed to determine the relative expression level of miR-133a in SW480 cells transfected with scramble miRNA (NC), miR-133a mimics and miR-133a inhibitor. (B) Western blot analysis was performed to examine the protein expression level of FSCN1 in SW480 cells transfected with miR-133a mimics and miR-133a inhibitor. Control, SW480 cells with no transfection. *P<0.01, vs. control. miR, micro RNA; NC, negative control; FSCN1, Fascin1.

