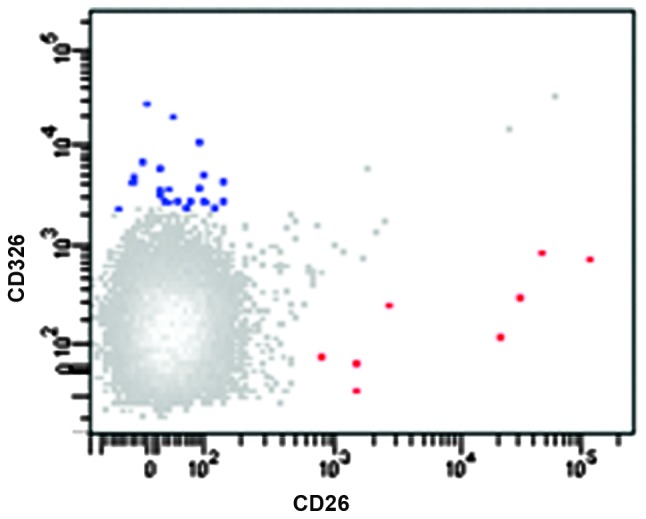
Figure 1.

CD326+ and CD26+/CD326− CTC detection. The CD326 versus CD26 dot plot shows a representative pre-operative sample of peripheral blood in which CD326+ (blue) and CD26+/CD326− (red) CTCs were detected. Cells were identified in the CD45-negative non-hematopoietic cell population. CD, cluster of differentiation; CTC, circulating tumor cell.
