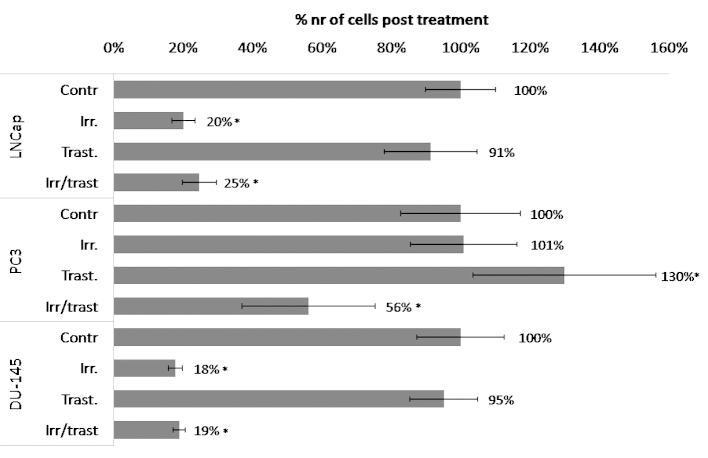
Figure 2.
Changes in proliferation rate in response to treatment. The graph shows changes in cell proliferation following treatment with irradiation/trastuzumab, which was administered in accordance with protocol A. The results are presented as the percentage change in proliferation (number of cells) compared with that of the control. Significance is indicated in the graph by * and standard deviation is indicated by the error bars.

