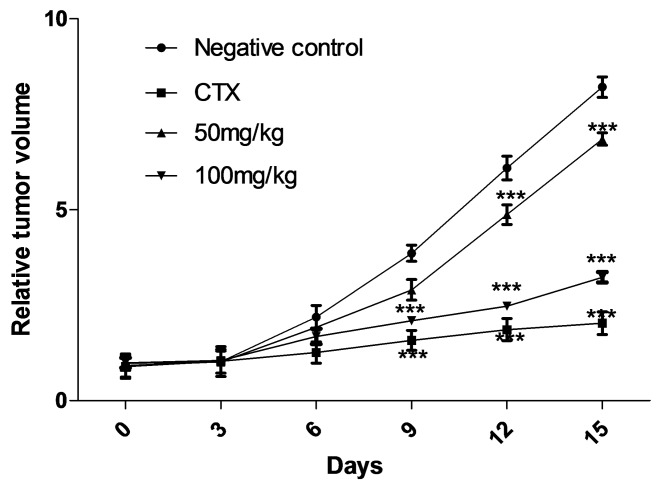
Figure 2.
Relative SGC-7901-derived tumor volumes of the nude mice treated with 50 or 100 mg/kg S03-EA or with the positive (CTX) or negative (saline) controls. Tumor volumes were measured and transformed to relative tumor volume as detailed in the Materials and methods section. Relative tumor volume is shown as the mean ± standard deviation. ***P<0.001, denotes a significant difference compared with the negative control.

