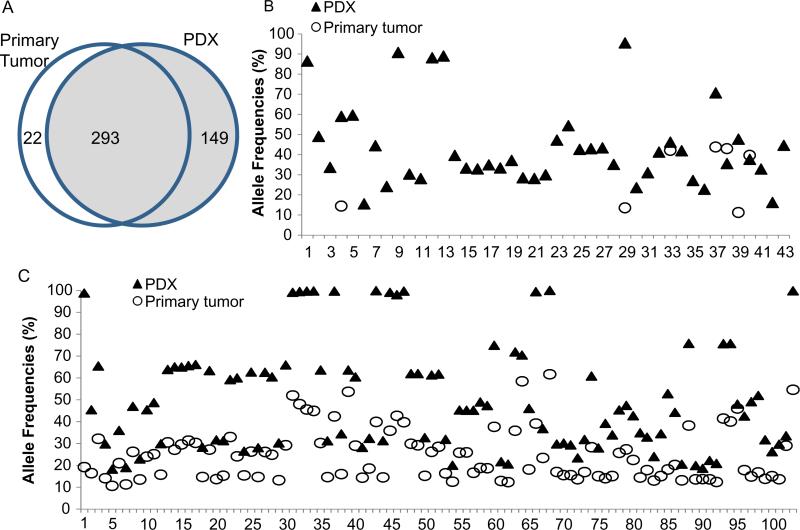
Fig. 3.
Comparison of mutations in primary tumors and corresponding PDXs. (A) Mutations identified in 23 pairs of primary tumors and PDXs, showing numbers of unique and common mutations. (B and C) Allele frequencies of mutations in 2 pairs of primary tumors and their corresponding PDXs. The numbers on the X-axis represent individual mutations detected in primary tumor and/or PDX. As shown in the graphs, the allele frequencies in PDXs are often dramatically greater than in the primary tumor. In the pair shown in B, a substantial number of mutations detected in the PDX were not detected in the primary tumor.

