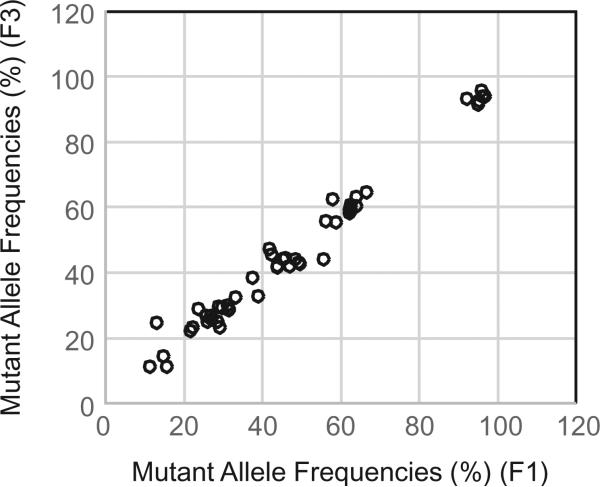
Fig. 4.
Mutations in different passages of the same PDXs. F1 and F3 passage samples from one PDX were analyzed for mutations in the 202 genes. The graph represents allele frequencies for 48 mutations detected in both F1 and F3 samples. Correlation analysis revealed that the allele frequencies detected in these two samples were well correlated (r = 0.988, P = 0.000).

