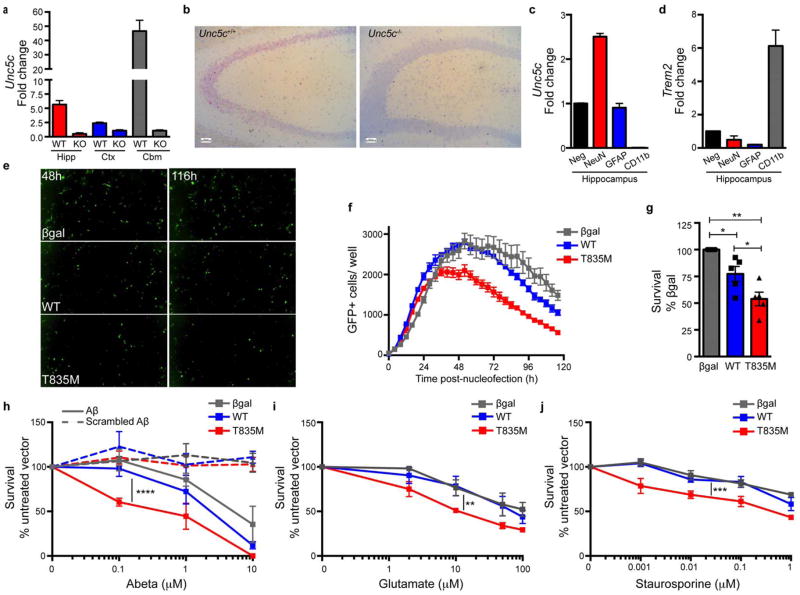
Figure 4. UNC5C is expressed in the adult hippocampus and T835M variant generally sensitizes hippocampal neurons to neurodegenerative cues.
(a) Unc5c in situ hybridization (red) Unc5c+/+ and Unc5c−/− adult mouse hippocampal coronal sections counterstained with hematoxylin (blue) (b) Unc5c quantitative PCR (qPCR) of Unc5c+/+ and Unc5c−/− mouse hippocampus (Hipp), cortex (Ctx), and cerebellum (Cbm), fold change normalized to Unc5c−/−, n=3 mice per genotype. (c, d) qPCR of adult Unc5c+/+ mouse hippocampi flow cytometry sorted for: neurons (NeuN), astrocytes (GFAP), microglia/ macrophages (CD11b) or a non-enriched negative population (c) Unc5c (d) Trem2, fold change normalized to negative population, n=3 Unc5c+/+ mice. (e) Representative images of cultured hippocampal neuron expression of βgal-, WT- and T835M UNC5C-IRES-GFP vectors at plateau of expression (48 h) and terminal time point (116 h). (f) Representative plot of GFP+ expression over time βgal (gray), WT (blue) and T835M UNC5C (red) (g) n=5 independent experiments with 60 images per condition, WT vs. T835M UNC5C by two-tailed unpaired t-test *p=0.0394, or two-tailed one sample t-test with βgal (theoretical mean) vs. WT *p=0.0319, or vs. T835M **p=0.002, respectively. (h–j) βgal gray), WT (blue) and T835M (red) UNC5C-IRES-GFP vector expressing hippocampal neurons were challenged with (h) Aβ1–42 or scrambled Aβ1–42 (i) glutamate (j) staurosporine. Surviving neurotoxin-treated cells normalized to their respective untreated vector controls (h) n=4 independent neuronal culture experiments, βgal (n=120 images) vs. WT (n=120 images) p=0.0609, WT vs. T835M UNC5C (n=120 images) ****p=1.77×10⁻⁹(j) n=3 independent experiments, βgal (n=90 images) vs. WT (n=90 images) p=0.6032, WT vs. T835M UNC5C (n=90 images) **p=0.001446 (i) n=3 independent experiments, βgal (n=90 images) vs. WT (n=90 images) p=0.323, WT vs. T835M UNC5C (n=90 images) **p=0.0005545. (b–d, g–j) data presented as mean ± SEM, (h–j) P value is from a likelihood-ratio test comparing two linear mixed models for growth curve analysis (fit using function lmer in the R package lme4): 1. model with the Dose: Treatment interaction term and 2. model without that term.

