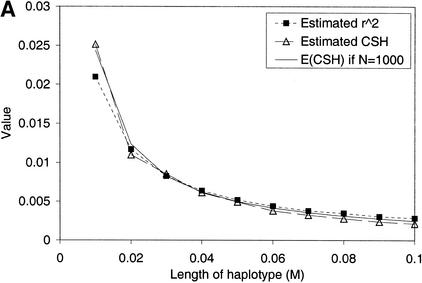
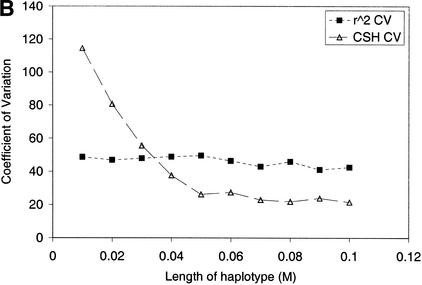
Figure 1.
(A) CSH and r2 from the simulated data set. Results are averaged over all haplotype regions of a given length, and over 200 replicates. (B) Coefficient of variation of r2 and CSH over all haplotype regions of the same length, across 200 replicates. (C) CSH from the data simulated with either an infinite alleles model or a stepwise mutation model. Results are averaged over all haplotype regions of a given length, and over 200 replicates.


