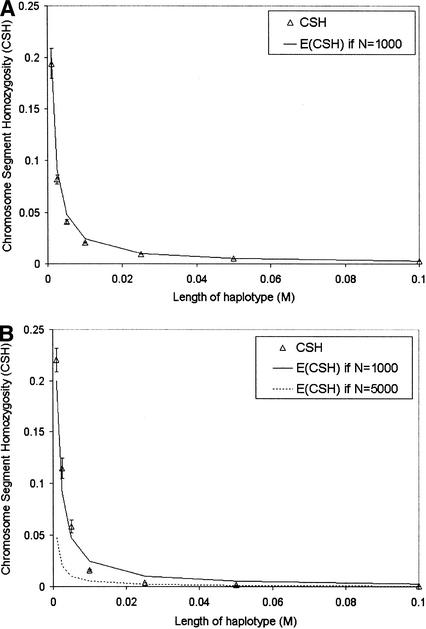
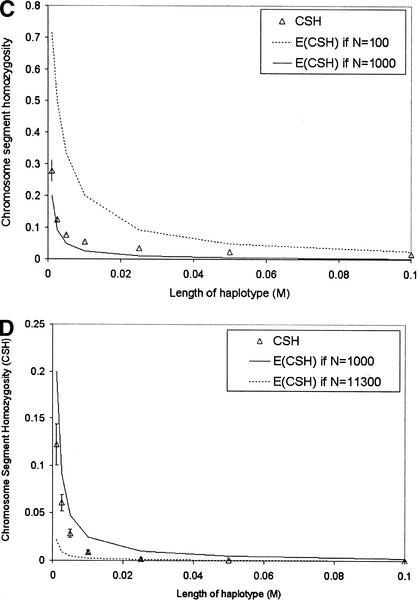
Figure 2.
Chromosomal homozygosity for different lengths of chromosome (given the recombination rate) for populations: (A) CONS (constant population size), (B) LINI (linearly increasing population size), (C) LIND (linearly decreasing population size), and (D) EXPI (exponentially increasing population size). The expected value of chromosomal homozygosity, 1/(4Nc + 1), is given on each graph for the maximum and minimum population sizes of each population. Standard error bars indicate variation among the 50 replicates.


