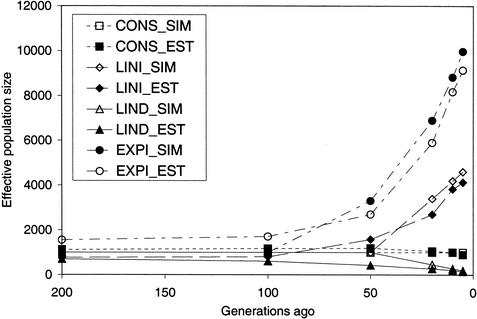
Figure 3.
Simulated and estimated effective population size over time for four populations; (CONST) constant population size from 0 to 6050 generations ago; (LINI) increase in population size in the last 50 generations from 1000 to 5000; (LIND) decrease in population size in the last 50 generations from 1000 to 100; (EXPI) increase in population size in the last 50 generations from 1000 to 11290. SIM and EST identify the simulated and estimated population sizes for each population.

