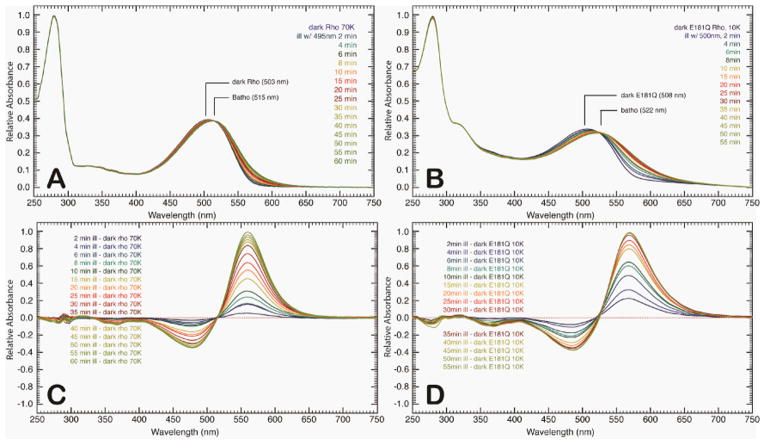
Figure 2.
Time-resolved absorption spectra of rhodopsin at 70 K (A) and E181Q at 10 K (B) following illumination by using a 495 nm and 500 nm light source, respectively. The absorption spectra were collected at the given time points following illumination. The difference spectra of the absorption profiles are provided for rhodopsin (C) and E181Q (D) and were obtained by subtracting the respective spectra of the dark state from the corresponding time point throughout the experiment.

