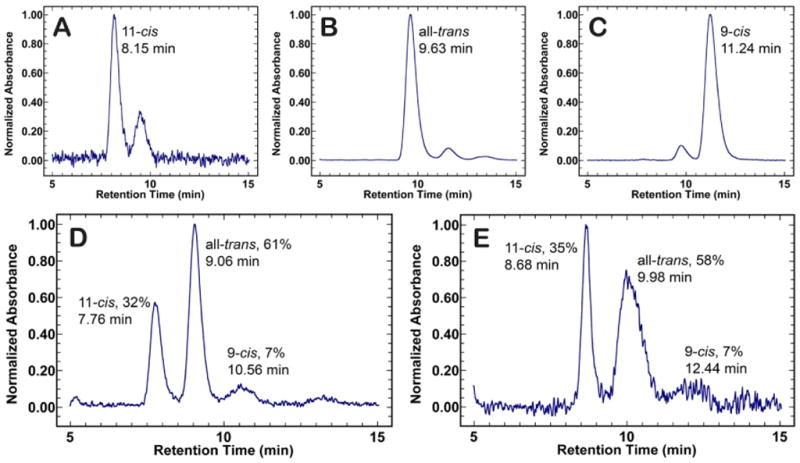
Figure 4.

HPLC chromatograms of retinal oxime standards and retinal oxime extractions of PSS506 and PSS383. Panels A, B, and C show the chromatograms for the 11-cis, all-trans, and 9-cis retinal oxime standards, respectively. Each standard peak represents the retention time for the syn oxime enantiomer of the retinal isomers. The percent of retinal isomers formed for PSS506 (D) and PSS383 (E) were determined by integrating under each peak.
