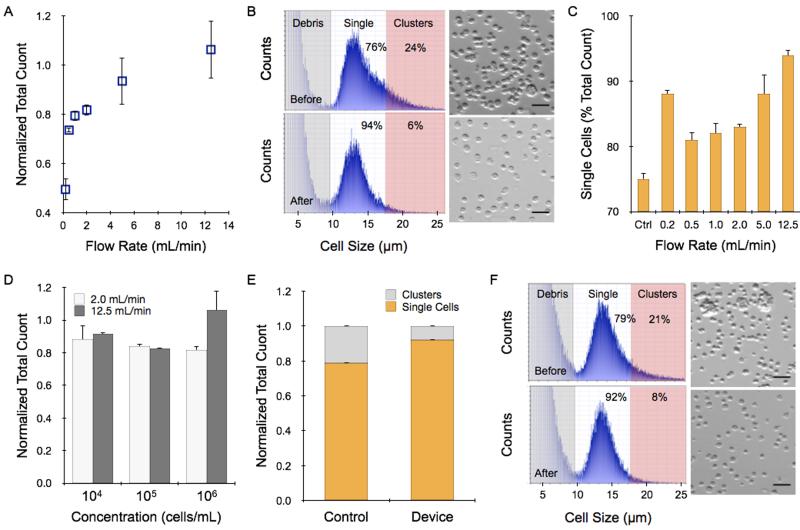
Figure 2. Dissociation of small clusters in cell suspensions.
(A-D) Cultured HCT 116 colon cancer cells were treated with trypsin-EDTA and the cell suspensions were passed through the microfluidic device. (A) Increasing flow rate led to progressively higher cell counts in the recovered sample, reaching approximately the same value as before addition to the device. (B) While total count was similar, the size distribution before (top) and after treatment at 12.5 mL/min (bottom) changed significantly. The peak size was approximately 13.5 μm for both cases, however prior to device treatment there was also a population of larger sizes corresponding to cell clusters. The device-processed sample was evenly distributed around the mean, indicating that nearly all events were single cells. The accompanying micrographs confirm average cell size and single cell content. (C) The percentage of single cells was determined as the counts between 9.5 to 17.5 μm compared to the total count. In general, increasing flow rate resulted in more efficient dissociation of cell clusters. (D) Total recovery was similar at lower initial concentrations, down to only 10,000 cells. (E-F) Single cell and total counts obtained for LS 174T colon cancer cell suspensions prior to and after passing through the microfluidic device at 12.5 mL/min. (E) Total recovery was again similar, with a greater percentage of single cells due to dissociation of cell clusters. (F) Population size distribution shifted to lower values after device treatment, indicating higher single cell content. All total count results obtained after device treatment were normalized to the value before treatment. Scale bars represent 50 μm. Error represent the standard error from at least three independent experiments.

