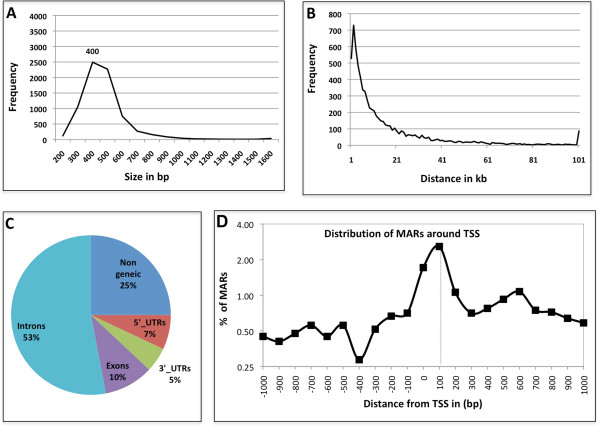
Figure 3.

MAR characteristics. (A) Size of MARs – in base pairs plotted against their frequency of occurrence in the genome. (B) Distribution of inter-MAR distances measured as distance between the midpoints of two contiguous MARs, plotted against their frequency of occurrence in the genome. (C) Genomic location of MARs, percentage of MARs localising in various genomic elements. (D) MARs occurring from -1 kb to +1 kb of TSS were plotted as a line graph. The graph shows that MARs associate preferentially with paused Pol II site at +100 bp.
