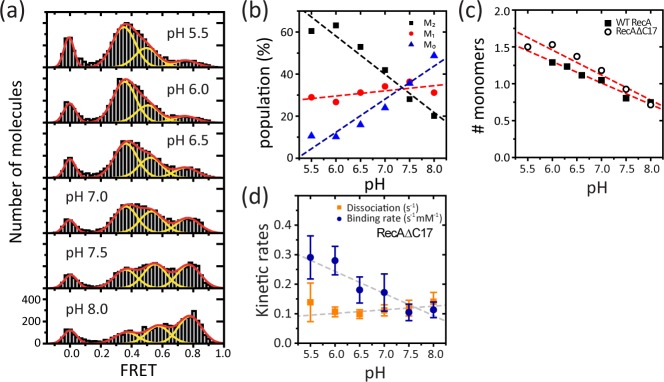
Figure 3. pH Dependence of the RecAΔC17 Filament at the 5′-disassembly End.

(a) Single molecule FRET histograms obtained at various pH with a RecA mutant of which negatively charged 17 amino acids in CTD are truncated (RecAΔC17). 0.5 μM RecA ΔC17 and 1 mM ATP were added in the reaction buffer with the same buffer condition as in Fig. 1. The histogram was fit with three Gaussian peaks for M0, M1, and M2 state, respectively, with additional peak at 0 for donor-only molecules. (b) The population for each peaks (symbols) found in (a) at various pH. Dashed lines are eye guides. (c) Average number of monomers bound between donor and acceptors (open circles for RecAΔC17) calculated from (b): Naverage = 2*P(M2) + 1*P(M1) +0*P(M0), where P(Mi) is the population in Mi state. Red dashed line is a linear fit to the data with a slope −0.34 for RecAΔC17. Data obtained with wild type RecA in Fig. 1D is also shown for comparison (filled rectangles). (d) The binding (blue) and dissociation (orange) rates of RecAΔC17 at different pHs. The error bars are standard deviations from three independent measurements. The slopes obtained by linear fit (dashed lines) are 0.01 and −0.07 for the dissociation and the binding rates, respectively.
