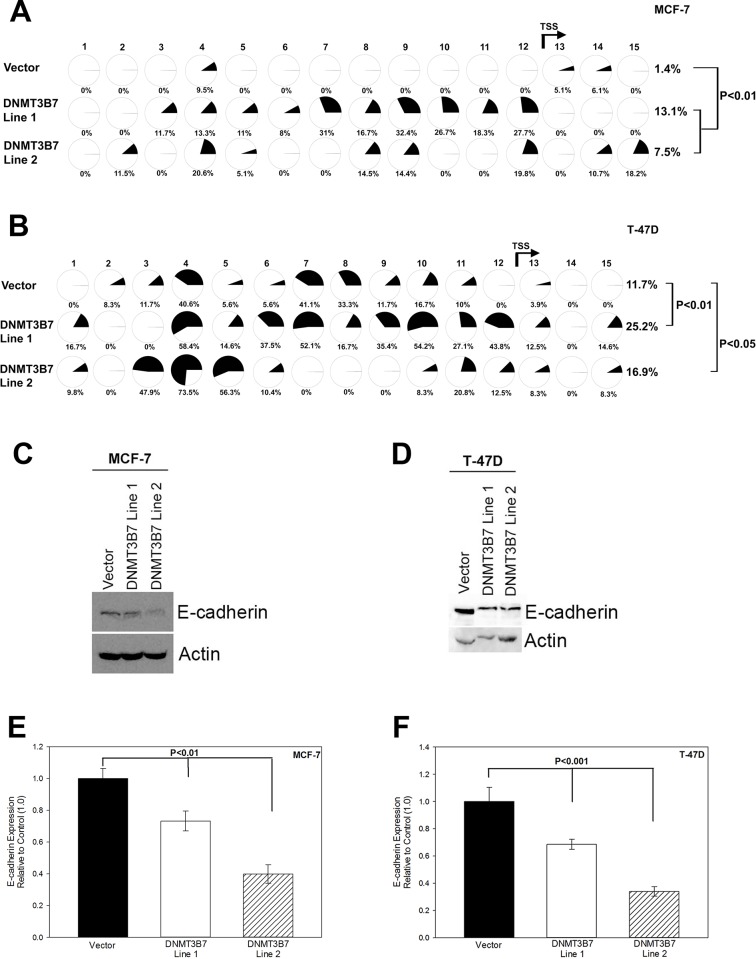
Figure 2. Hypermethylation and down-regulation of E-cadherin in the presence of DNMT3B7.
Genomic DNA from stably transfected DNMT3B7-expressing cell lines and vector controls was collected, bisulfite treated, and subjected to methylation-specific PCR analysis. Primers were designed to incorporate 15 CpGs within an island encompassing the promoter region, exon 1, and the translation start site (TSS, indicated by the arrow between CpG 12 and 13). Dark shading in pie charts indicates percent of methylated C:T ratio at 15 CpG sites in (A) MCF-7 and (B) T-47D cells expressing DNMT3B7 or a control vector. Immunoblot analysis of E-cadherin expression compared to an actin loading control in (C) MCF-7 and (D) T-47D cells correlates with methylation data. Quantitative analysis using densitometry of representative blots is shown for (E) MCF-7 and (F) T-47D cells. Statistical significance is indicated on the graphs.

