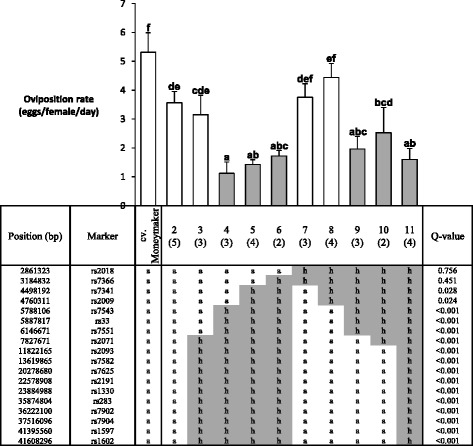
Figure 5.

Fine mapping of OR-5 . Oviposition rate (mean ± standard error) and marker data of F2BC4S1 plants grouped by introgressed fragment, based on marker scores. Different letters in oviposition rate graph indicate statistical significance according LSD (P = 0.05). The number of plants per specific introgression fragment is shown in brackets. Q-value: FDR corrected P-value per marker after t-test. Marker score nomenclature: a = homozygous cv. Moneymaker allele; b = homozygous S. habrochaites (CGN1.1561) allele; h = heterozygous. Chromosomal positions are according to International Tomato Annotation Group (ITAG) Release 2, official annotations on the SL2.31 can be found in [41], marker sequences in [40].
