
Figure 1.
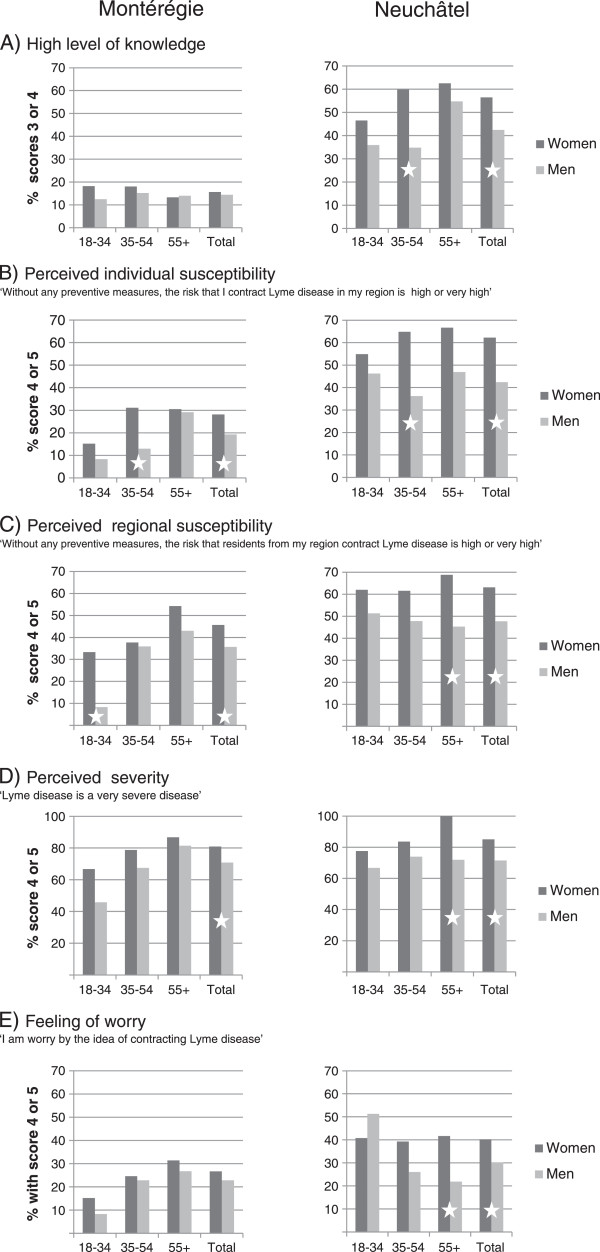
Distribution of high levels of knowledge (A), perceived individual susceptibility (B), perceived regional susceptibility (C), perceived severity (D) and feeling of worry (E) in both regions, according to gender and age groups (dark gray represents proportions in women and light gray in men; stars represent significant differences in proportions between women and men in different age groups and globally).