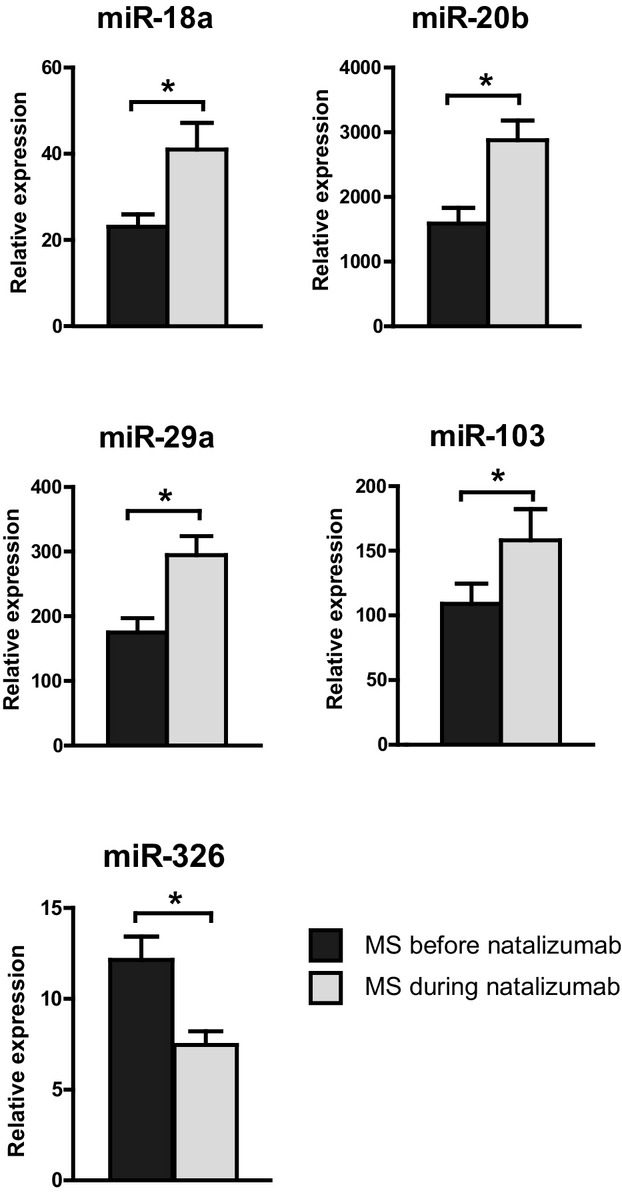
Figure 1.

Regulation of miRNAs in the course of natalizumab therapy. Shown are quantitative PCR expression levels of selected miRNAs identified by exploratory array analysis (Table S1) and confirmed by TaqMan® quantitative PCR analysis. Data reflect fold changes in expression normalized to that of the housekeeping gene from 17 patients’ blood samples before and after at least 12 months of natalizumab treatment. Shown are mean + SEM from all ΔCT values measured in duplicate per patient (asterisks denominate statistical significance, P < 0.05). For samples obtained under therapy, blood was drawn in the moment before the regular natalizumab infusion was applied.
