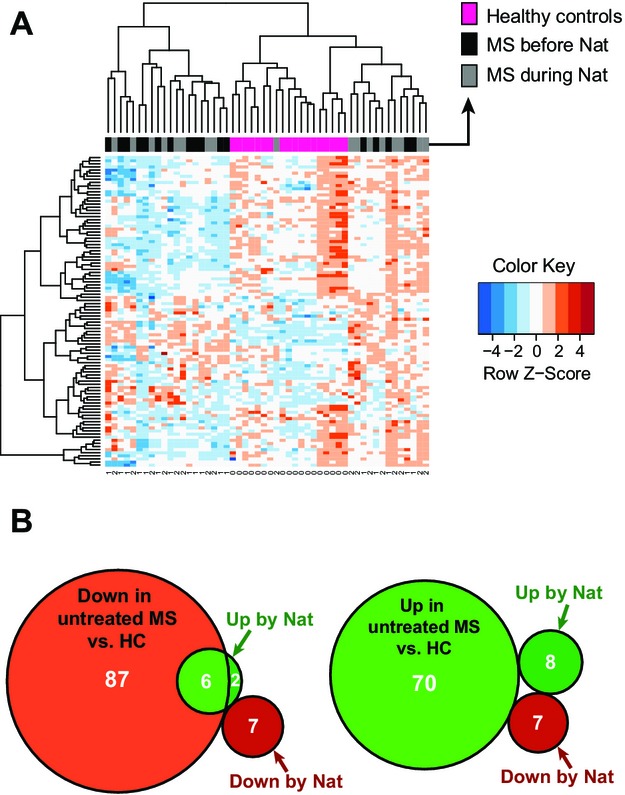
Figure 2.

(A) Heat map using three data sets (healthy controls, multiple sclerosis [MS] before natalizumab, MS during natalizumab). In order to cluster the data we applied complete linkage hierarchical clustering of the miRNA patterns using the Euclidian distance as distance measure. To focus on the most informative miRNAs, the 100 with highest data variance have been selected. Nat = natalizumab treatment. B) Venn diagrams showing the overlapping miRNA targets for comparison of untreated MS subjects versus healthy controls (HC) and MS patients pre- versus postnatalizumab treatment. The left diagram shows the overlap of miRNAs downregulated in untreated MS with natalizumab-regulated miRNAs (Up by Nat: upregulated in natalizumab treatment; Down by Nat: downregulated in natalizumab treatment). The right diagram shows the overlap of miRNAs upregulated in untreated MS patients versus healthy controls (HC) with natalizumab-regulated miRNAs.
