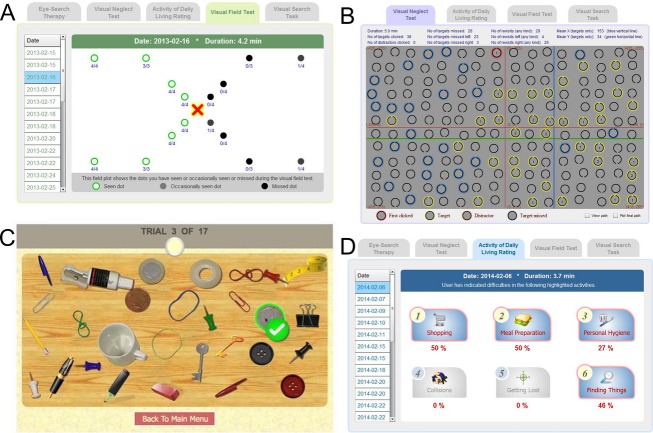
Figure 1.
Screen shots from the four Eye-Search cognitive tests. (A) Visual field test, showing a patient with a right-sided, homonymous hemianopia with macular splitting. (B) Neglect test from a different patient showing leftward neglect. Targets are circles with a gap at the top. Those that were correctly selected are outlined in yellow; missed targets are outlined in blue. Numbers within targets are revisits (abnormal). The average target position (always in the center of the field) is shown in red crosshairs, while the average position of targets selected is in blue and green crosshairs; this shows the patient's average spatial bias (to the right in this case). (C) Crowded desk scene for the main outcome measure (visual search). In this case the subject has correctly located the 20 pence coin to the right of fixation. (D) Output from a different patient's T0 activities of daily living (ADL) ratings.

