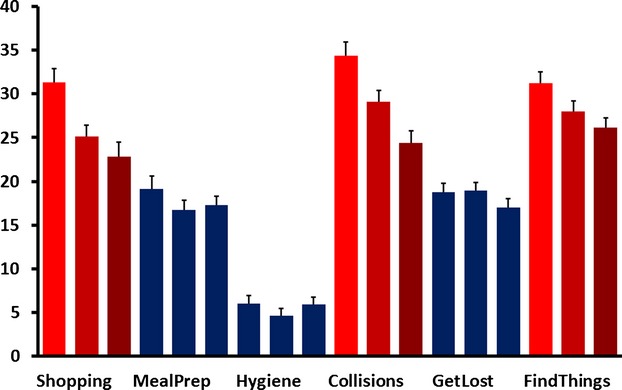
Figure 3.

Average, self-reported difficulty ratings (y-axis in %) for the six activities of daily living (ADL) categories. For each category three scores are shown, one for each time point left-to-right (T0–T1–T2). Categories that significantly declined over time are shown in red, those with no significant change are in blue. Error bars show within subject, standard error of the mean.
