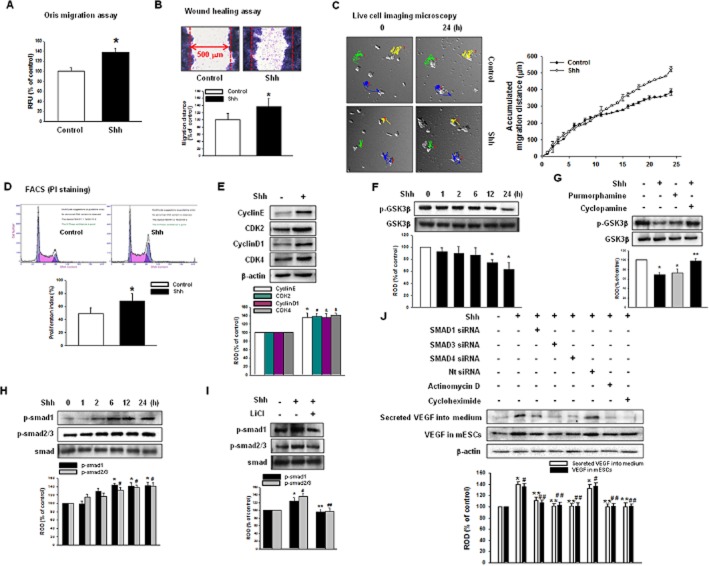
Figure 2.
Effect of shh on mESC migration and proliferation in vitro. mESCs were treated with shh for 24 h. (A) Oris Cell Migration assay was performed and stained with calcein-AM (5 μM). Fluorescence in the analytical zone was quantified with a plate reader. (B) Wound-healing migration assay was performed and stained with Diff-Quik. Data represent the mean ± SD of three independent experiments with triplicate dishes. *P < 0.05 versus control. (C) Live cell imaging microscopy shows directed migration of mESCs under influence of shh. Coloured line and number in image indicate the tracked cells to measure the migration distance and the graph denotes the accumulated distance of migration analysed by the multidimensional acquisition package of Meta Morph v.7.01 software (Molecular Devices). (D) mESCs were subjected to PI staining for cell cycle analysis by flow cytometry. The gates were configured manually to determine the percentage of cells in S phase based on the DNA content. The data is calculated using proliferation index [(S + G2/M)/(G0/G1 + S + G2/M)] × 100 and reported as the mean ± SD of four independent experiment, each conducted in triplicate. *P < 0.05 versus control. (E) Protein expression of cyclin E, CDK2, cyclin D1 and CDK4 were detected by immunoblot. The lower panel depicts the mean ± SD of four independent experiments for each condition, as determined from densitometry relative to β-actin. *P, #P, &P, $P < 0.05 versus control. (F) mESCs were treated with shh for various time (0–24 h), and the expression of p-GSK3β was detected by immunoblot. (G) mESCs were treated with cyclopamine (SMO inhibitor; 10−5 M) prior to shh treatment for 24 h or cells were treated with purmorphamine (SMO agonist; 10−5 M) for 24 h and expression of p-GSK3β was detected by immunoblot. The lower panel depicts the mean ± SD of four independent experiments for each condition, as determined from densitometry relative to GSK3β. *P < 0.05 versus control; **P < 0.05 versus shh. (H) mESCs were treated with shh for various times (0–24 h), and the expression of p-Smad1 and p-Smad2/3 were detected by immunoblot. (I) mESCs were treated with LiCl (GSK3β inhibitor; 10−5 M) prior to shh treatment for 24 h, and the expression of p-Smad1 and p-Smad2/3 were detected by immunoblot. The lower panel depicts the mean ± SD of four independent experiments for each condition, as determined from densitometry relative to Smad. *P < 0.05 versus control of p-Smad1; **P < 0.05 versus shh of p-Smad1; #P < 0.05 versus control of p-Smad2/3; ##P < 0.05 versus shh of p-Smad2/3. (J) mESCs were transfected with Smad1 siRNA (20 nM), Smad3 siRNA (20 nM), Smad4 siRNA (20 nM) or Nt siRNA (20 nM) for 24 h prior to shh treatment for 24 h and the VEGF secreted into the medium and the expression of VEGF in mESCs were detected by immunoblot. The lower panel depicts the mean ± SD of three independent experiments for each condition, as determined from densitometry relative to β-actin. *P < 0.05 versus control of secreted VEGF into medium; **P < 0.05 versus shh of secreted VEGF into medium; #P < 0.05 versus control of VEGF in mESCs; ##P < 0.05 versus shh of VEGF in mESCs.

