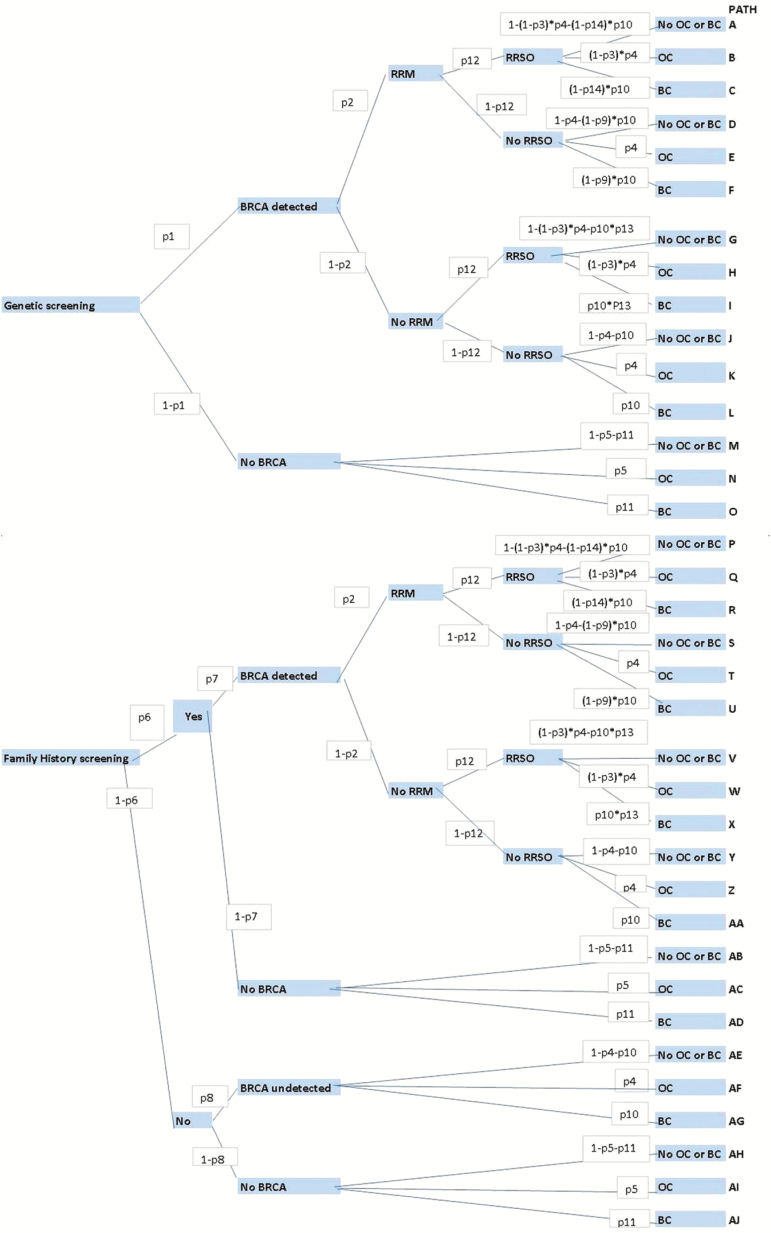
Figure 1.
Decision model structure. The upper part of the model structure reflects a population-based approach to BRCA testing, and the lower part of the model depicts a family history (FH)–based approach. Each decision point in the model is called a “node,” and each path extending from a node is called a decision “branch.” Each branch represents a mutually exclusive course or outcome. Each decision is given a probability (probabilities p1 to p14 used in the model are explained in Table 1) highlighted in a white box along the decision branch. Values for each outcome are calculated. Cancer incidence was estimated by summing the probabilities of pathways ending in ovarian or breast cancer. Final outcomes (blue boxes on the right of the figure) of each path include development of breast cancer (BC), ovarian cancer (OC) and no breast/ovarian cancer (no OC or BC). BC = breast cancer; No OC or BC = no ovarian cancer or breast cancer developed; OC = ovarian cancer; RRSO = risk-reducing salpingo-oophorectomy; RRM = risk-reducing mastectomy.

