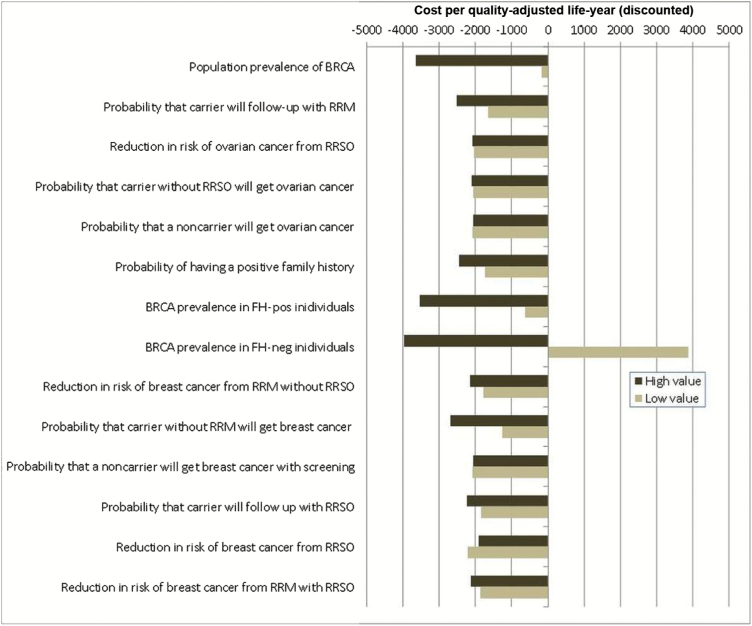
Figure 2.
Deterministic sensitivity analysis for model probabilities. One-way sensitivity analysis for all probabilities in terms of the incremental cost-effectiveness ratio (ICER) of population-based screening compared with a family history (FH)–based approach for BRCA testing. X-axis: ICER: cost (£) per quality-adjusted life-year (QALY) (discounted). Y-axis: probability parameters in the model. The model is run at both lower and upper values/limits of the 95% confidence interval or range of all probability parameters given in Table 1. “High value” represents outcomes for upper limit, and “Low value” represents outcomes for lower limit of the probability parameter. Outcomes to the left of the midline “0” value on the X-axis indicate that the model is cost saving. FH = family history; neg = negative; pos = positive; RRSO = risk-reducing salpingo-oophorectomy; RRM = risk-reducing mastectomy.

