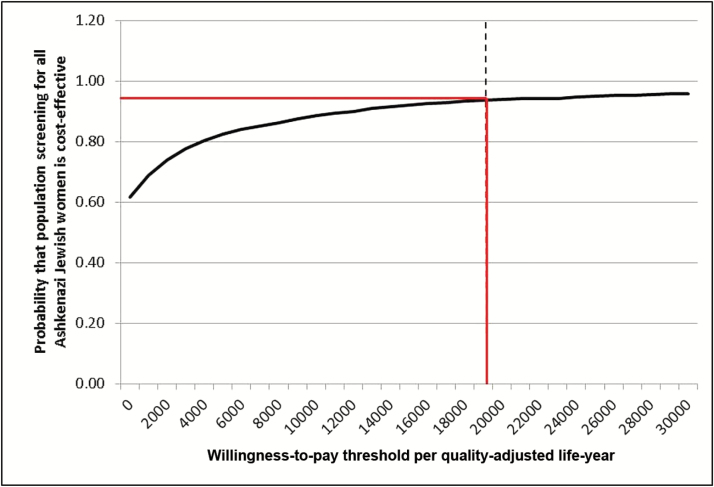
Figure 4.
Cost-effectiveness acceptability curve. Probabilistic sensitivity analysis in which all model parameters/variables are varied simultaneously across their distributions to further explore model uncertainty. X-axis: Incremental cost-effectiveness ratio in terms of cost (£s)/quality-adjusted life-year. Y-axis: proportion of simulations. The results of 1000 simulations were plotted on a cost-effectiveness acceptability curve showing the proportion of simulations (Y-axis), which indicated that the intervention was cost-effective at different willingness-to-pay thresholds (X-axis). The solid red line marks the proportion of simulations found to be cost-effective at the £20 000 threshold used by NICE. 94% simulations are cost-effective in this analysis.

