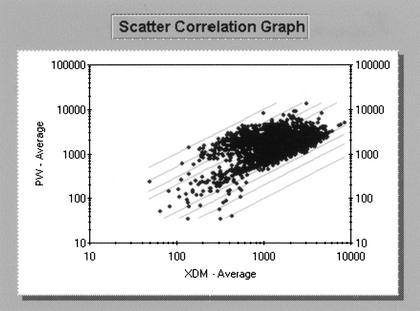
Figure 2.
Results from competitive hybridizations between RNA samples obtained from cells grown in XDM medium (labeled with Cy3) and PW medium (labeled with Cy5). Each spot on the array is represented by a dot in the scatter plot shown above. The graph displays the specific, background-subtracted, average intensities for each gene on the array. Gray lines represent fold change values comparing the Cy3 and Cy5 intensities. Lines below the diagonal represent XDM/PW values of two-, three-, five- and 10-fold, respectively. Lines above the diagonal represent XDM/PW ratios of 1/2, 1/3, 1/5, and 1/10.

