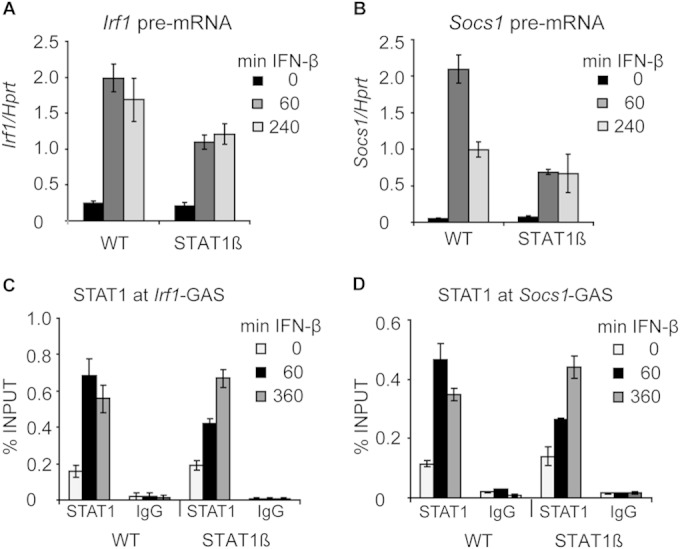
FIG 6.

Analysis of IFN-β-induced gene expression and STAT1 promoter occupancy in BMDMs expressing solely the STAT1β isoform. (A and B) IFN-β-induced transcription in WT and STAT1β BMDMs. Cells were stimulated with IFN-β; total RNA was isolated; and the levels of Irf1 (A) and Socs1 (B) pre-mRNAs were analyzed by qRT-PCR. Error bars indicate standard deviations for biological replicates (n = 3). (C and D) STAT1 promoter occupancy in WT and STAT1β BMDMs. BMDMs were stimulated with IFN-β for the indicated times. STAT1 occupancy at the Irf1-GAS (C) and Socs1-GAS (D) sites was analyzed by ChIP. Error bars represent standard deviations (n = 3).
