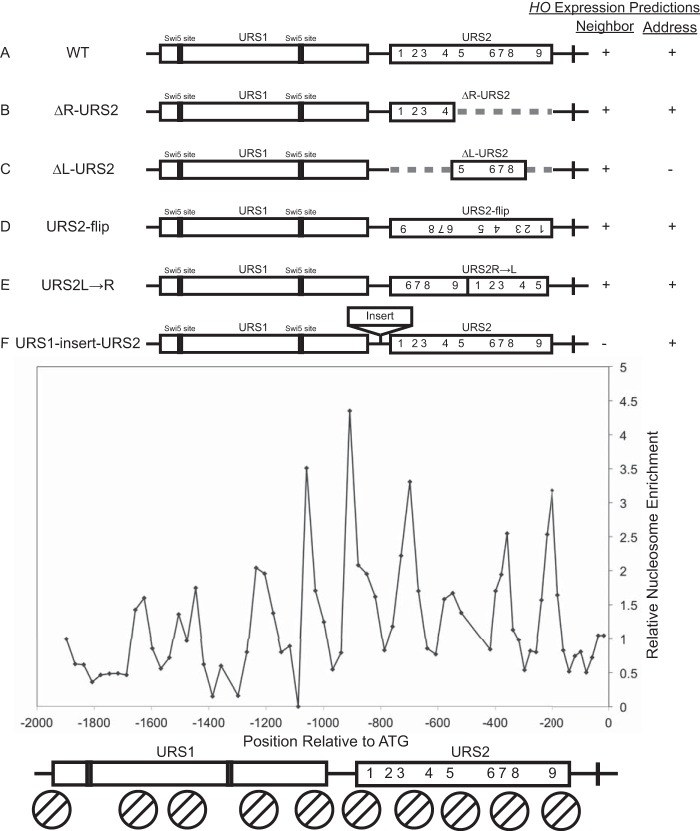
FIG 2.
Neighborhood and address models. Top, diagrams of the HO promoter, with rectangles indicating URS1 and URS2. Swi5 site locations in URS1 are indicated, and numbers indicate SBF sites in URS2. Dashed lines present in panels B and C indicate deletions of either the right-half or the left-half URS2 sequence. The right-hand rectangle in panel D represents a URS2 sequence inversion. Reordered URS2 rectangles in panel E represent a URS2 rearrangement in which the right half of URS2 was moved in front of what was originally the left half of URS2. Rectangle between URS1 and URS2 in panel F indicates the location of insertions tested in this paper. Right, predicted HO expression for all tested constructs according to the neighborhood and address models, as described in the text. Lower, H3 nucleosome enrichment over the HO promoter. Enrichment peaks indicate the midpoints of nucleosome positions, and determined nucleosome locations are represented below by circles with two diagonal lines. Nine nucleosomes can be observed along the HO promoter, centered at the following positions: bp −1628, −1478, −1208, −1058, −908, −698, −548, −358, and −198 with respect to the ATG.

